The Key Innovations
Automatically data model link
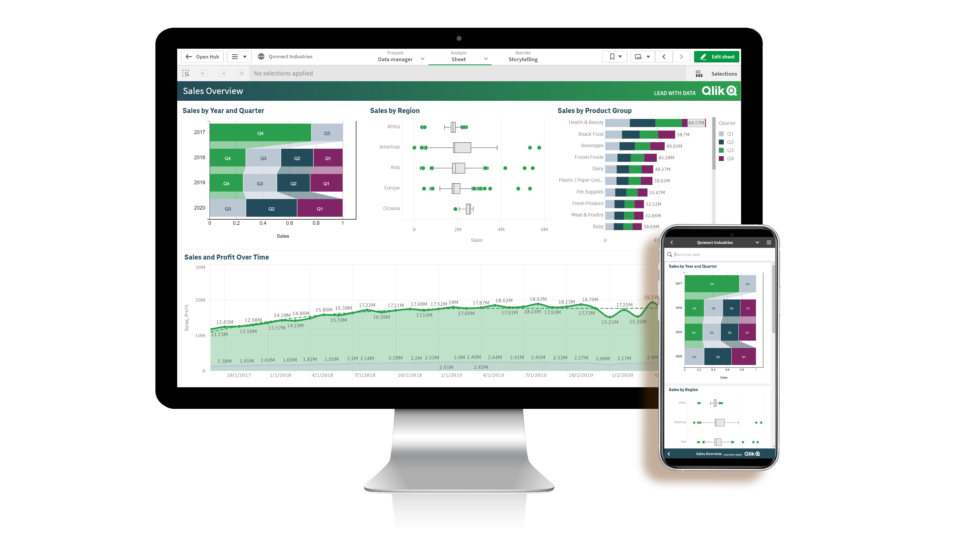
Automatically linking between the in-memory data model and the in-place data model allows us to support the visualization interactions where you can click on everything, and the dashboard responds, just like the users are expecting from their usual experience with Qlik Sense. The dashboard selections are reflected in the queries against the data warehouse.
Built-in memory cache
Another feature is the built-in memory cache. This enables caching of queries and allows the BI-department and IT-department to balance the need for live data against how often to query your underlying data source. This enables enhanced performance, as repeated queries hit the cache, but is also a tool for balancing costs, performance, and how fresh the data is.
Combine Qlik Sense LiveQuery by Stretch Qonnect with in-Memory calculation
The combination of calculations between Qlik Sense LiveQuery by Stretch Qonnect and in-Memory in the same calculation is supported. As an example, let’s say there is a requirement for a calculation of the “Total Revenue” from all the customers across every line in the ERP system divided by the numbers of customers. The ERP data is in a Snowflake data warehouse and the customers are loaded in-memory in Qlik Sense. This calculation can be implemented by a Qlik Sense LiveQuery to Snowflake where the data warehouse calculates the total revenue and divide it by a simple in-memory count of customers. Traditionally to support this calculation, you either must load all the data on the lowest level or produce an aggregated table with the relevant data. With LiveQuery combining data allows the users to have leaner data models on a higher level but still supporting the application with analysis on the lowest level.
Combine Qlik Sense LiveQuery across multiple data warehouses
Another feature is the option to connect to multiple warehouses and create measures combining calculations across them. For instance, we have a customer ranking KPI that is a composite of data, defined like:
“Total Revenue” / “Years Of Being a Customer” * “Retention Probability”
- Total revenue is calculated from the ERP data from the snowflake data warehouse.
- The customer “Retention Probability” is calculated from a Google BigQuery (or other) data warehouse driving machine learning.
- Lastly, the measure “Years Of Being a Customer” is calculated from the in-memory data modeling in Qlik Sense.
This way of combining these data in Qlik makes it possible to do new things and enables the users to support dashboards that earlier were impossible or possible but might not be practical and not feasible in a traditional Qlik environment.


