Vizlib Self-Service

Vizlib custom report in Qlik Sense

Vizlib Self-Service | The Ultimate Ad-hoc Reporting for Qlik Sense

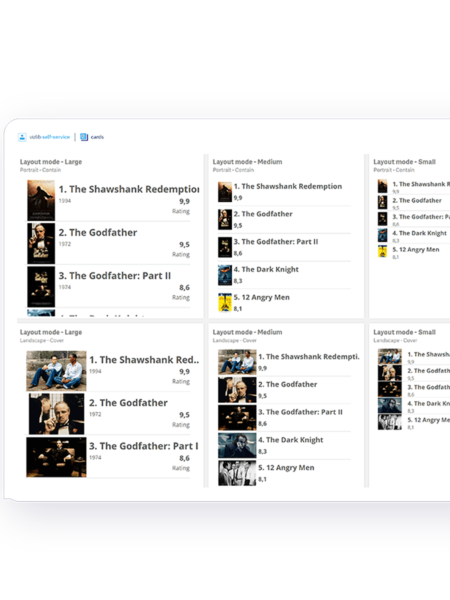
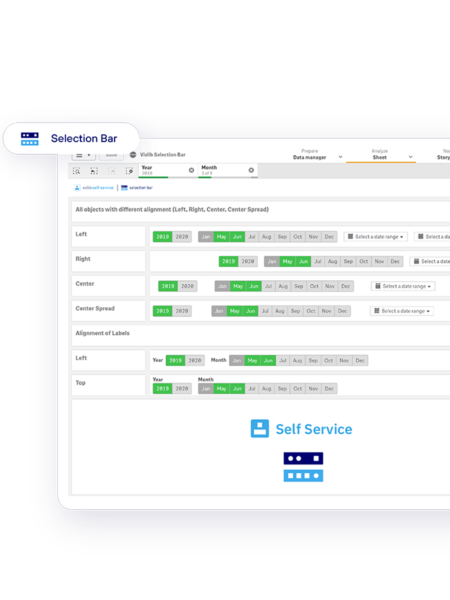
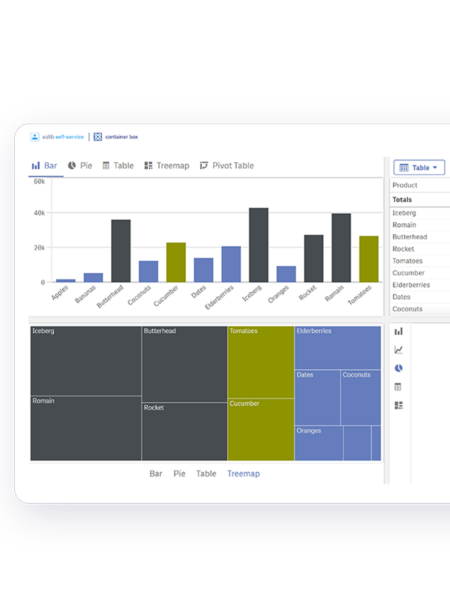
Vizlib Self-Service empowers your organization to create a secure data sandbox. This way, all types of users, from largely non-technical people to super users, will be able to explore their data independently and discover meaningful insights faster.

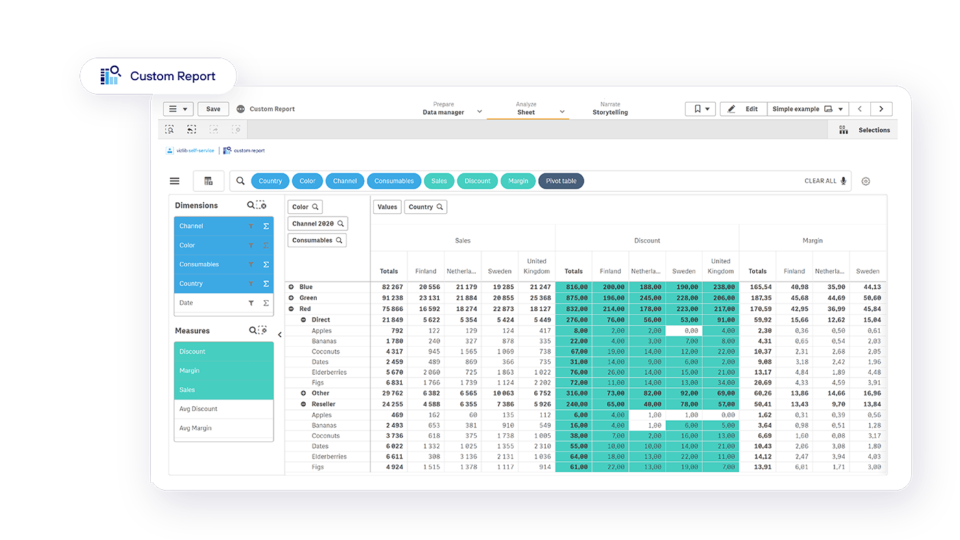
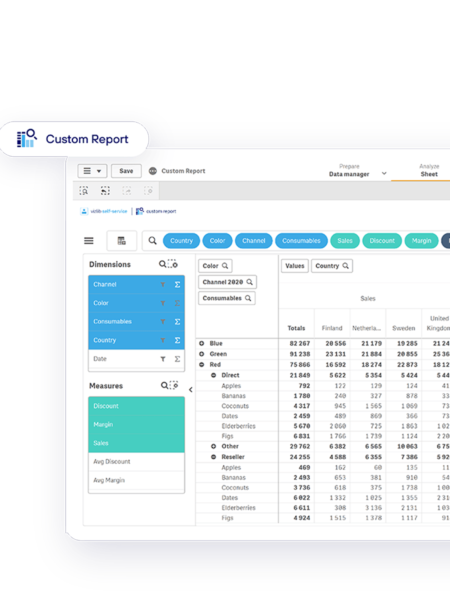
Make easy-to-use custom reports that give your users the capability to slice-and-dice data with less dependency on IT.

Stretch Qonnect is a proud Vizlib Partner. We sell and implement Vizlib’s products. Our experts help you make sure you are getting the maximum value from your investment.

Free Trial


Product Demo

Vizlib custom report in Qlik Sense
Vizlib card for Qlik Sense

Included in Vizlib Self-Service for Qlik Sense

Vizlib Self-Service consists of several extensions that will take your Qlik Sense self-service to the next level.

Custom Report

The most powerful self-service solution and all-around reporting magic tool. Create dynamic straight or pivot tables based on data in master tables and convert interesting findings into other types of visualizations within the Custom Report. Plus, enjoy dozens of beautiful presets and rich customization options.

Cards Extension

Snazz up your dashboards with pictures of products, logos, or even people! This table extension with cards as cells and responsive design also supports selections, multiple layouts, and image size options, and a “Select and Go to Sheet” mode.


UX/UI Components

Selection Bar

This horizontal selection bar has pre-selected values that allow fields, variables, and flags to be displayed. Also available: preset selections, linking to other Qlik Sense documents, and the ability to set variables and select dates quickly.

Container Box

Save real-estate on your dashboard by including alternative objects within the same space. Container Box allows you to switch between different objects either through a menu or via icons. And you can go as far as adding a container within a container!

Vizlib Tiles

Create customized tile-style summaries that add visual flair to your data organization. Easily choose the layout and formatting that suits your reporting needs with the dynamic table structure. Vizlib Tiles uses a single dimension and a number of measures so you can include images, descriptions and even ratings as layers.

Free Trial

Vizlib self service selection bar for Qlik Sense
Vizlib container in Qlik Sense

Contact us