Vizlib Library

Vizlib Qlik Sense dashboard

Vizlib Library | Take Qlik Sense to the Next Level

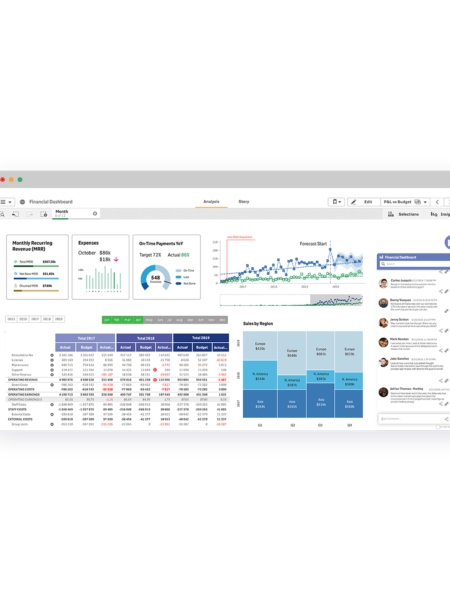
Vizlib Library is a powerful package of essential extensions to the Qlik Sense Platform. Leverage the powerful visual analytics products to save countless hours of development and deliver solutions the organization will love.

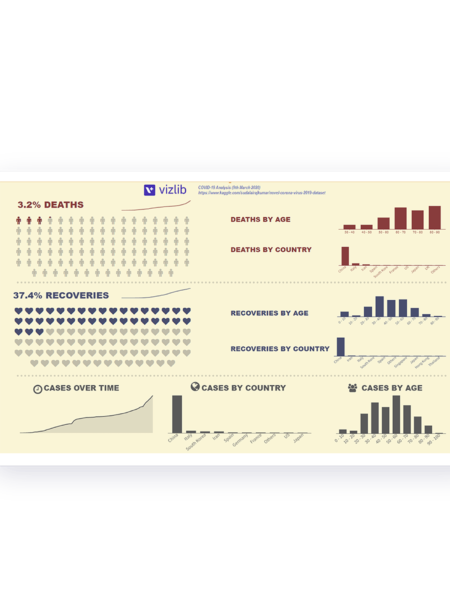
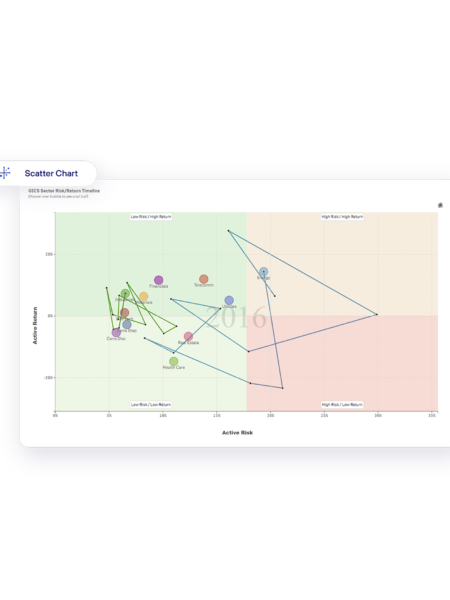
The Vizlib Library consists of a range of amazing extensions covering new and improved visualizations, integrated advanced analytics, improved navigational elements, new UX components, and much more.

Stretch Qonnect is a proud Vizlib Partner. We sell and implement Vizlib’s products, and our experts help you make sure you are getting the maximum value from your investment.

Free Trial


Product Demo | Vizlib Library

Vizlib line chart for Qlik Sense
Vizlib Qlik Sense dashboard

Included in Vizlib Library for Qlik Sense

Vizlib Library consists of a lot of extensions that will save you time on development and help take your Qlik Sense environment from reporting to data storytelling.

Essential Charts

Get amazing improvements to your favorite visualizations with the essential charts in the Vizlib Library. These charts include valuable improvements to line charts, scatter charts, bar charts, combo charts, and pie charts. Add reference lines, custom HTML tooltips, benchmark bars, alternative states, customizable backgrounds, and more.

Advanced Charts

Add new advanced visualizations with extra capabilities. Vizlib’s advanced charts give you more dynamic control and rich formatting. Add advanced versions of KPIs, activity gauge, heatmap, mekko chart, waterfall chart, Venn diagram, Sankey chart, and story timelines.

UX Components

Improve the styling and formatting options of your Qlik Sense dashboard with new UX components like improved sliders, advanced text objects, advanced calendars, better filters, line objects, buttons, and switches. Get much more with improved UX Components.

Navigational Elements

Redefine how you navigate in Qlik Sense, using the Vizlib Sheet Menu and Container Grid. Completely remove the need for complex mashup development.

Tables

Vizlib’s straight and pivot tables are famous for good reasons. Make tables easier to read and understand and add more capabilities with HTML tooltips, dynamic column resizing, indicators, rich formatting, and more.

Free Trial

Vizlib Qlik Sense Dashboard using Vizlib Library
Vizlib scatter plot

Contact us